

Author: Site Editor Publish Time: 2026-09-17 Origin: Site


Buoyancy engineering has its own vocabulary, and most specification errors start with a term being used loosely. The eight definitions below are the ones that decide whether a foam core survives ten years at depth or crushes on its first descent.
StruCell® is a closed-cell, cross-linked PVC structural foam supplied as boards in seven density grades from P45 (48 kg/m³) to P250 (250 kg/m³), plus a recycled grade (Rigicore P). It is used as a sandwich core: the foam carries shear and local compression while the skins carry bending, which is why the same board can stiffen a boat hull and provide buoyancy at depth.
Working depth is the water depth a grade can hold continuously without losing its geometry. It is defined by a total volume deformation below 1% during a four-hour hold, with essentially no further change per hour — the practical test for a part that must keep its displacement and its buoyancy margin for years.
Crush depth is the pressure at which the foam loses 5% of its initial volume under a defined ramp rate (0.1 MPa/s). It is a dynamic threshold, not a service rating: above it, cell walls collapse permanently and the part loses displacement that no later inspection recovers.
Hydrostatic pressure rises by roughly 0.1 MPa for every 10 m of seawater depth, so 30 m is about 0.3 MPa, 50 m is 0.5 MPa and 280 m is 2.8 MPa. Every specification in this article can therefore be read as a depth: the P80 data at 0.5 MPa describes exactly what a part sees at 50 m.
Volume deformation is the change in a sample's volume after a pressure hold, measured by the displacement method and expressed as a percentage of the original volume. It is the most direct measure of whether a foam has merely flexed or has started to collapse: 0.16% is elastic recovery, while 8.88% is permanent loss.
Water absorption is the mass of water taken up by a sample after pressurisation, quoted as a percentage of dry mass. Because absorbed water has almost the same density as seawater, a 2.49% uptake in a 80 kg/m³ foam shifts the part's density by about 2 kg/m³ — small, but worth tracking when the buoyancy margin is tight.
A closed-cell foam keeps each gas pocket sealed, so water cannot wick through the core the way it does through open-cell material. StruCell® grades are above 95% closed cell, which is why water uptake stays in the low single digits even after a four-hour hold at 0.5 MPa.
The buoyancy margin is the difference between the displacement a part provides and the load it must carry, expressed as a percentage. Depth-rated designs normally keep a margin large enough to absorb water uptake, skin weight gain and the slow creep of the foam over service life — which is why a working depth well above the operating depth is the usual design choice.
You are designing a part that has to do two opposite things at once: displace water to create lift, and resist the pressure that comes with depth. Density sits exactly between those requirements. A lighter board gives more lift per unit volume but crushes at a shallower depth; a denser board resists more pressure but displaces less. Choosing the grade is therefore a calculation, not a preference — and the two numbers that settle it are the foam's compressive strength and the hydrostatic pressure at the target depth.
StruCell® grades span a compressive strength range from 0.6 MPa at P45 to 6.2 MPa at P250, which corresponds to a working-depth range from 30 m to 280 m. Between those two points every additional density step buys roughly 30–60 m of depth. The table below puts the density, stiffness and strength values side by side so the trade-off is visible before any specification is written.
| Grade | Density (kg/m³) | Compressive strength (MPa) | Compressive modulus (MPa) | Tensile strength (MPa) |
|---|---|---|---|---|
| StruCell® P45 | 48 | 0.6 | 50 | 1.4 |
| StruCell® P60 | 60 | 0.93 | 70 | 1.8 |
| StruCell® P80 | 80 | 1.4 | 90 | 2.5 |
| StruCell® P100 | 100 | 2.0 | 135 | 3.5 |
| StruCell® P130 | 130 | 3.0 | 170 | 4.5 |
| StruCell® P200 | 200 | 4.8 | 240 | 7.1 |
| StruCell® P250 | 250 | 6.2 | 300 | 9.2 |
Two consequences follow from the table. First, density and strength rise together but not linearly: moving from P80 to P100 raises density by 25% while compressive strength rises by about 43%, so the higher grade is often the more efficient choice once a depth threshold is crossed. Second, the modulus values show why a foam that is strong enough may still be unsuitable — a low-modulus core deflects under the same load even if it does not collapse, which changes the shape and the hydrodynamic behaviour of the finished part.
"Cellular plastics used as buoyancy material must be characterised for both compressive creep and water absorption, because buoyancy loss in service is the sum of the two."
A submerged foam core is loaded in a way that is easy to underestimate. Pressure acts on every face of the part, not only on the top surface: a board at 50 m sees about 0.5 MPa pressing on all sides, and the resulting strain is governed by the foam's bulk response, not by the skin. When a sandwich panel with sealed skins is submerged, the pressure differential across the skin transfers almost the entire load into the core, which is why a core chosen for stiffness at the surface may fail at depth even though the panel never changed.
Three mechanisms then act at the same time, and each one has its own threshold:
Temperature and time shift all three thresholds. A grade tested at room temperature will show a lower crush depth in cold seawater and a lower creep resistance over a service life measured in years rather than hours. That is why the design margin between operating depth and working depth should be treated as a real allowance, not as a safety factor to be trimmed at the tendering stage.
For a first estimate, compare the operating pressure with the compressive strength of the candidate grade and keep the working-depth value well above the operating depth. In the next section the same logic is applied to real test data measured on StruCell® boards at 0.5 MPa, which is the pressure at 50 m — the depth where the difference between two neighbouring grades becomes unmistakable.
The clearest way to separate two grades is to hold both at the same pressure and measure what changes. In our hydraulic test a sample is pressurised to 0.5 MPa — the hydrostatic pressure at 50 m of seawater — and held until its geometry stabilises; the sample is then released and measured for volume deformation and water absorption. Six samples of each grade are tested so that scatter is visible rather than averaged away.
Every sample in this dataset was taken from our own production: the boards tested are StruCell® structural PVC foam core manufactured by UNION COMPOSITES and drawn from routine output, not laboratory specimens prepared for the test. The values below therefore describe the material a customer actually receives, batch to batch, which is what makes them usable as design input rather than as a best-case demonstration.
Two methods define the numbers. Volume is measured by the displacement method: V1 before pressurisation, V2 after, with the change expressed as (V2 − V1) / V1 × 100%. Water absorption is measured by mass: the sample is dried at 50 °C for 24 h, cooled and weighed (m1), then after pressurisation the surface is blotted, the sample is immersed in anhydrous ethanol for about one minute to displace surface water, blotted again, air-dried for one minute and weighed immediately (m2), giving (m2 − m1) / m1 × 100%.
| Sample | m1 dry mass (g) | m2 after pressure (g) | Water absorption | V1 / V2 (volume) | Deformation at 4 h |
|---|---|---|---|---|---|
| 1 | 14.9751 | 15.2726 | 1.99% | 183.5 / 183.2 | −0.16% |
| 2 | 14.8812 | 15.4556 | 3.86% | 182.3 / 182.1 | −0.11% |
| 3 | 15.0421 | 15.5019 | 3.06% | 183.6 / 183.4 | −0.11% |
| 4 | 15.0232 | 15.2579 | 1.56% | 183.7 / 183.3 | −0.22% |
| 5 | 15.0174 | 15.3429 | 2.17% | 183.6 / 183.1 | −0.27% |
| 6 | 14.9771 | 15.3192 | 2.28% | 182.6 / 182.4 | −0.11% |
| Average / max | — | — | 2.49% / 3.86% | — | −0.16% / −0.27% |
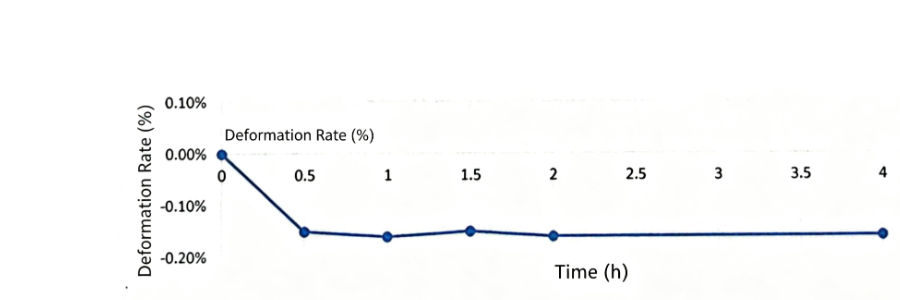
P80 under 0.5 MPa: the deformation curve flattens within the first half hour and stays between roughly −0.14% and −0.16% for the remaining hold, which is elastic behaviour rather than collapse.
| Sample | m1 dry mass (g) | m2 after pressure (g) | Water absorption | Deformation at 4 h |
|---|---|---|---|---|
| 1 | 11.6528 | 12.5427 | 7.64% | −8.9% (collapse region) |
| 2 | 11.6129 | 12.4371 | 7.10% | collapse region |
| 3 | 11.3484 | 12.0821 | 6.47% | collapse region |
| 4 | 11.3520 | 12.3410 | 8.71% | collapse region |
| 5 | 11.6837 | 12.5821 | 7.69% | collapse region |
| Average / max | — | — | 7.41% / 8.71% | −8.88% / −9.56% |
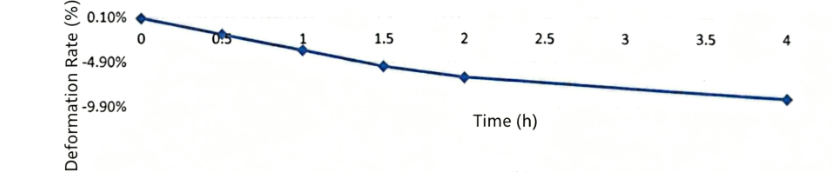
P60 at the same 0.5 MPa: the curve keeps falling towards −9% instead of levelling off. The grade is not creeping — it is collapsing, and the displacement it loses is permanent.
Read together, the two data sets give a rule that is easy to apply in a specification: at 50 m, P80 deforms by about 0.16% and absorbs 2.49% of water on average, while P60 deforms by 8.88% and absorbs 7.41%. The volume loss is the number that matters for buoyancy — a part that loses nearly 9% of its volume loses nearly 9% of its lift, and no amount of skin thickness restores it.
Water absorption tells a consistent story: once the cells begin to collapse, the structure opens up and water uptake rises by a factor of three compared with a grade still inside its elastic range. In service that combination compounds — less volume and more mass at the same time, both pushing the buoyancy margin in the wrong direction.
The two measurements above turn into a design table once they are repeated across the density range. Working depth is the depth a grade can hold continuously while total deformation stays below 1% — verified by extending the hold to four hours and checking that the sample has stopped moving. Crush depth is the pressure at which the initial volume loss reaches 5% under a 0.1 MPa/s ramp. Together they bracket the safe design window for each density.
| Grade | Working pressure (MPa) | Working depth (m) | Crush pressure (MPa) | Crush depth (m) |
|---|---|---|---|---|
| StruCell® P60 | 0.3 | 30 | 0.5 | 50 |
| StruCell® P80 | 0.5 | 50 | 0.95 | 90 |
| StruCell® P100 | 0.8 | 80 | 1.3 | 130 |
| StruCell® P130 | 1.2 | 120 | 2.1 | 200 |
| StruCell® P200 | 1.9 | 190 | 3.2 | 300 |
| StruCell® P250 | 2.8 | 280 | 5.0 | 500 |
The measured 50 m test sits exactly on the boundary the table predicts. P80 has a working depth of 50 m and, tested there, deforms by 0.16% — comfortably inside the 1% criterion. P60 has a working depth of 30 m and a crush depth of 50 m, and at 50 m it deforms by 8.88%, beyond the 5% loss that defines crushing. The table and the test agree, which is the useful property of a dataset generated from the same physical mechanism rather than from separate assumptions.
In practice, design at 60–80% of working depth when the part sees repeated or long-duration exposure, and reserve the region between working depth and crush depth for short excursions. A part rated for 30 m that occasionally reaches 45 m is a very different case from one that lives at 45 m, because creep is a function of time as well as of pressure.
A four-hour hold answers the strength question; it does not answer the longevity question. For that, production samples of several grades — again taken from our own StruCell® output — were soaked under 3 bar — roughly 30 m of water — and weighed periodically over a period of about 570 to 738 hours, with density tracked against the dry-weight baseline established after a 72-hour pre-soak.
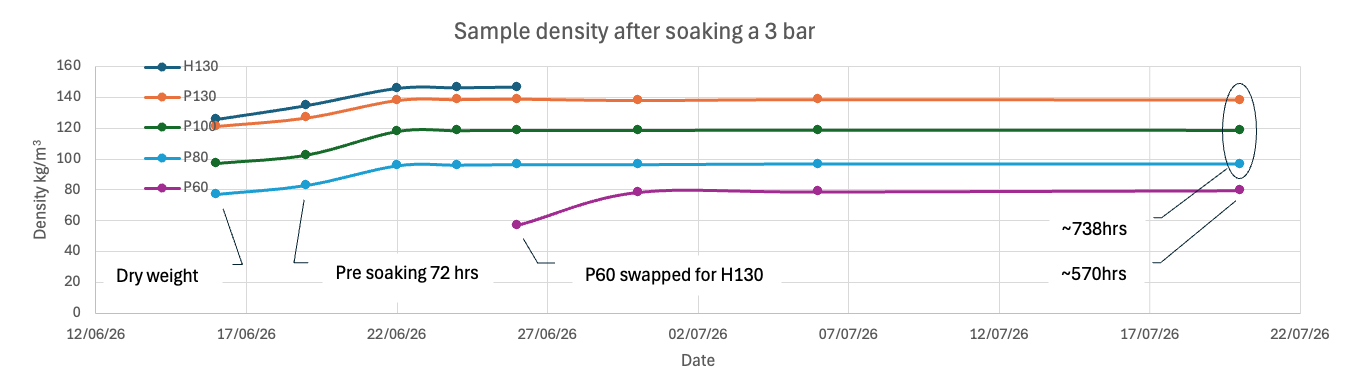
Density tracked against the dry-weight baseline during a 3 bar soak of more than 570 hours. The curves stay close to their starting values, which is the behaviour a closed-cell core is expected to show under long-duration immersion.
What matters in a long soak is not the absolute density but its drift. Because absorbed water replaces air in the cells, a foam that takes up water becomes denser and loses buoyancy simultaneously. Tracking mass over hundreds of hours shows whether the uptake curve has flattened — the point at which the accessible cell volume has filled and further exposure no longer changes the part's mass. Grades that sit in the upper part of their working range reach that plateau quickly and then stay there.
Two design conclusions come out of the soak data. First, a buoyancy part should be sized with the plateau value in mind rather than with a dry-condition density, since that is the condition it will spend its service life in. Second, the slower a grade approaches its plateau, the more conservative the allowance should be — which is another argument for choosing a density with working depth above the operating depth rather than at it.
P60 and P80 are the two grades most often compared for marine and buoyancy work, and the comparison is instructive because the difference in density is only 20 kg/m³ while the difference in depth capability is far larger. The table below sets the measured behaviour side by side at the same 50 m condition, together with the catalogue values that explain the result.
| Criterion | StruCell® P60 | StruCell® P80 |
|---|---|---|
| Density | 60 kg/m³ | 80 kg/m³ |
| Compressive strength | 0.93 MPa | 1.4 MPa |
| Working depth (under 1% deformation) | 30 m | 50 m |
| Crush depth (5% volume loss) | 50 m | 90 m |
| Measured deformation at 50 m / 4 h | −8.88% (max −9.56%) | −0.16% (max −0.27%) |
| Measured water absorption at 50 m | 7.41% (max 8.71%) | 2.49% (max 3.86%) |
| Lift per cubic metre | Higher (about 940 kg/m³ net displacement in seawater) | Lower (about 920 kg/m³ net displacement in seawater) |
| Best fit | Wind blade shells, RV and boat components, shallow flotation, insulation-led parts | Buoyancy modules to 50 m, ROV and marine structures, sports cores, hull and deck sandwich |
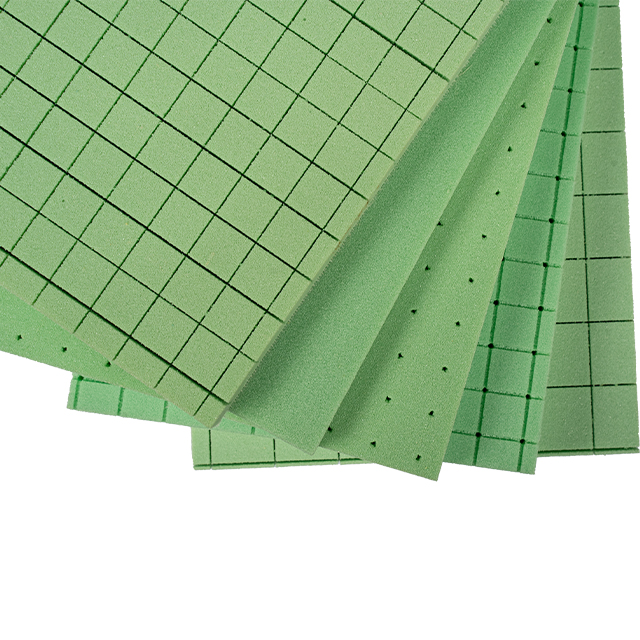
StruCell® P80 board from our own production — the grade used for the 50 m hydraulic test above, supplied plain or grooved and perforated for resin flow.
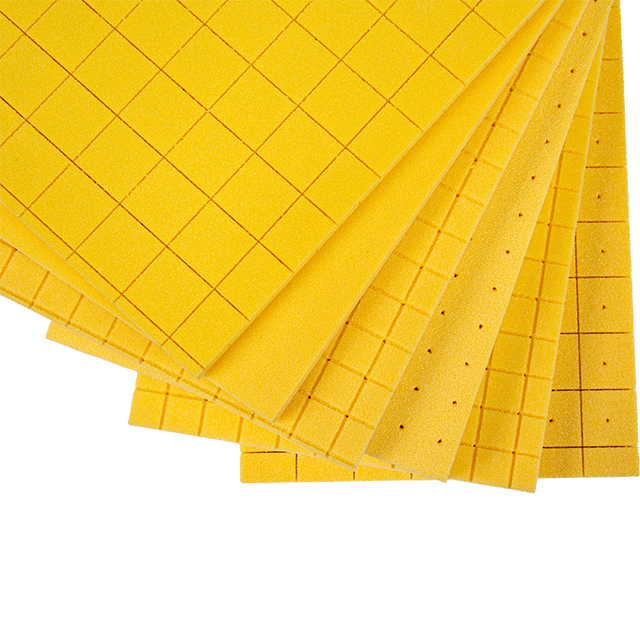
StruCell® P60 board from the same production line: the lighter grade for shallow-depth flotation, hull and deck cores, where lift per kilogram matters more than pressure rating.
Choose P60 when the part stays inside 30 m, when weight saving matters more than pressure rating, or when the core's job is stiffness and insulation rather than displacement. It is a strong fit for wind blade shells, RV panels, shallow flotation and boat components that never see sustained depth. Its 0.93 MPa compressive strength is ample for sandwich shear in these applications, and its lower density gives the best lift per kilogram at shallow depth.
Choose P80 the moment the design depth reaches 40–50 m, when the part is load-bearing as well as buoyant, or when service life is measured in years of immersion. The measured behaviour at 50 m — 0.16% deformation and 2.49% absorption — leaves a real margin against the 1% criterion, whereas P60 at the same depth is already past its crush threshold. For ROV buoyancy, marine structures and any part that must keep its displacement, P80 is the default grade.
If the answer is still unclear, the deciding question is what happens on the worst day: a P60 part that reaches 50 m loses about 9% of its volume permanently, while a P80 part that reaches the same depth recovers. Designing to the worst case rather than the nominal case is usually what settles the grade.
Most buoyancy problems are decided before the first part is cut, in the specification. The seven errors below are the ones that show up repeatedly in marine and subsea projects.
"Buoyancy material selection is a creep-and-absorption problem before it is a strength problem: the design question is what the part displaces after years at depth, not what it displaces on the day it is installed."
This is the sequence we recommend between grade selection and series supply. It is written so that a design engineer, a purchasing team and a fabricator can all work from the same list, and so that the evidence exists before it is requested.
Water absorption is the slowest-acting variable in a buoyancy design and the one most often left out of the calculation. StruCell® grades are closed-cell above 95%, which is the property that keeps uptake low: each cell is a sealed gas pocket, so water can only enter through cut surfaces, damaged cells or the polymer matrix itself. The measured figures follow that structure — 2.49% for P80 after a four-hour hold at 50 m, and 3.86% in the worst sample of the set.
| Property | Value | Effect on a buoyancy part |
|---|---|---|
| Closed-cell content | above 95% | Limits water to cut surfaces and defects rather than allowing wicking through the core |
| Thermal conductivity | 0.035–0.055 W/m·K (P45 at 0.035) | Keeps the core useful as insulation as well as structure, useful in cold-chain and subsea enclosures |
| Water absorption at 50 m (P80) | 2.49% average | About 2 kg/m³ of density gain at plateau — a small, predictable reduction in lift |
| Thickness range and tolerance | 2–70 mm, ±0.2 mm | Lets displacement be calculated from the drawing rather than measured on every part |
| Marine durability references | P45 holds DNV GL TAK00001DV for LNG containment; P130 and P200 grades are qualified for marine composite structures | Provides third-party evidence for offshore and naval specifications |
Over a service life the calculation is cumulative. Take a 1 m³ buoyancy module in P80: dry mass is 80 kg, so it displaces about 944 kg of seawater and provides roughly 864 kg of net lift. At the measured absorption plateau it gains about 2 kg and loses a negligible amount of volume, so the net lift falls by roughly 0.2%. Repeat the same calculation with a grade that crushes and the picture changes completely — an 8.88% volume loss removes about 84 kg of displacement, an order of magnitude more than the water uptake.
A buoyancy part is only as good as its edges and joints. Because water enters through cut cells, the fabrication route has a direct effect on the absorption figure measured later. Three practices keep the as-built performance close to the tested value:
StruCell® boards are supplied in standard sheet sizes by grade — for example P60 at 2450 × 1150 mm, P80 at 2280 × 1080 mm, P100 at 2100 × 1000 mm and P130 at 1900 × 900 mm — with plain, grooved, perforated and double-cut formats for resin flow. Cutting parts within the supplied sheet size reduces both waste and the number of bonded joints in a buoyancy module, which is where most moisture paths begin.
It depends entirely on density. StruCell® grades are rated from a 30 m working depth at P60 to 280 m at P250, with crush depths of 50 m and 500 m respectively. P80 covers 50 m working depth, P100 covers 80 m and P130 covers 120 m — so most subsea requests land on P80 to P200.
Choose P80 for anything at or beyond 40 m. Measured at 50 m, P80 deforms by 0.16% and absorbs 2.49% of water, while P60 deforms by 8.88% and absorbs 7.41% — P60 has passed its crush depth at that pressure. P60 remains a good choice below 30 m where weight and cost matter more than pressure rating.
Working depth is the depth at which total deformation stays below 1% during a four-hour hold, with no measurable change per hour. Crush depth is the pressure at which initial volume loss reaches 5% under a 0.1 MPa/s ramp. Working depth is the design value; crush depth is the limit you never design into.
At 50 m water depth and a four-hour hold, P80 absorbed 2.49% of its dry mass on average with a worst sample of 3.86%. That corresponds to roughly a 2 kg/m³ density gain — a small, calculable reduction in lift. Uptake rises sharply once the foam is pushed past its working depth, because collapsing cells open the structure.
Yes, when it is sized correctly. Soak testing at 3 bar for more than 570 hours shows density staying close to the dry baseline, which is the plateau behaviour expected from a closed-cell core. For permanent immersion, design at 60–80% of the working depth and calculate the buoyancy margin at the plateau mass rather than the dry mass.
Yes. The boards are CNC-machined to complex profiles and bonded with epoxy or polyurethane systems; grooved and double-cut surfaces improve resin flow for lamination. In a subsea part, seal the cut faces afterwards — a machined surface is where water can enter the cell structure most easily.
Sheets are supplied by grade — P60 at 2450 × 1150 mm, P80 at 2280 × 1080 mm, P100 at 2100 × 1000 mm and P130 at 1900 × 900 mm, with smaller panels for grooved and contoured formats. Thickness runs from 2 mm to 70 mm with a tolerance of ±0.2 mm, and custom thicknesses can be produced for volume programmes.
Cold water increases the apparent stiffness of the polymer while long exposure makes creep more significant, so a grade validated by a short test at room temperature should be re-checked against the service temperature. P45 is rated for continuous operation at −25 °C and is the usual choice for cold-chain and LNG-adjacent applications, with DNV GL TAK00001DV certification.
The range includes DNV GL TAK00001DV for P45 in LNG containment service, DNV GL certification for marine composite structures such as P200, and UL94 V-0 flame rating on P130. Density and compression are verified to ISO 845 and ISO 844, which are the two properties an offshore specification normally asks to see per batch.
Yes — StruCell Rigicore P is a recycled structural PVC foam core for applications where mechanical requirements allow a recycled feed stream. It suits non-critical panels, tooling and secondary structures; for depth-rated buoyancy, virgin grades remain the appropriate choice because their property scatter is documented batch by batch.
Buoyancy design reduces to three numbers: the pressure at the operating depth, the working depth of the grade, and the water absorption at that pressure. The measured data in this article puts real values on all three — at 50 m, P80 deforms by 0.16% and absorbs 2.49%, while P60 deforms by 8.88% and absorbs 7.41%. The difference between the two grades is not a matter of degree; it is the difference between a part that keeps its displacement and a part that does not.
Practical selection then follows from two habits. Design to working depth rather than to the nominal requirement, and calculate the buoyancy margin at the soaked plateau rather than at dry weight. Both are cheap at specification stage and expensive after the tooling exists.
For depth-rated parts, start with StruCell® P80 structural PVC foam board for buoyancy to 50 m, or step up to StruCell® P100 and P200 where the design depth passes 80 m. For shallow flotation, boatbuilding and RV work, StruCell® P60 gives the best lift per kilogram, and P250 covers the highest mechanical loads and flame-retardant requirements.
Application pages worth reading next: buoyancy foam, marine buoyancy foam, flotation foam, boat building foam core and high-density PVC foam core.
Send us the depth profile, the load case and the target buoyancy margin, and we will confirm the grade, the thickness and the data behind them — including the hydraulic test results at your operating pressure and the samples needed for a validation panel.
A buoyancy specification is only as reliable as the test behind it, and the numbers quoted in this article come from a procedure that can be repeated on a customer's own material. A sample is placed in a hydraulic pressure vessel, pressurised to the target pressure — 0.5 MPa for 50 m of seawater — and held until its geometry stabilises. In practice the P80 samples stopped moving within the first half hour, which is why the four-hour figure is quoted: it demonstrates the sample is in the elastic region rather than still relaxing.
| Test parameter | Setting used | Why it matters for the result |
|---|---|---|
| Hold pressure | 0.5 MPa | Equal to 50 m of seawater, the depth where the P60/P80 difference becomes decisive |
| Hold duration | until stabilised, reported at 4 h | Separates elastic deformation from ongoing creep and collapse |
| Samples per grade | 6 | Shows scatter rather than hiding it in a single average |
| Volume method | displacement, V1 before and V2 after | Measures the geometry that produces buoyancy, not only mass |
| Absorption method | dry 50 °C / 24 h → m1; ethanol displacement then m2 | Ethanol removes surface water so only absorbed water is counted |
| Crush criterion | 5% initial volume loss at 0.1 MPa/s | A dynamic limit that is deliberately stricter than a strength value |
The sequence matters as much as the equipment. Drying before the test fixes the dry mass that absorption is calculated against; blotting and the ethanol step prevent surface water from inflating the reading; and weighing immediately after the ethanol evaporates avoids re-absorption from humid air. Skip any of the three and the reported absorption can double without the material changing at all.
Choosing a grade that just covers the operating depth is the most common way to shorten a buoyancy part's life. A working depth already carries a 1% deformation allowance for a four-hour hold; a part that is expected to sit at depth for a decade needs more room than that, because creep continues at a rate the short test cannot measure. Ratios of 60–80% of working depth are the practical range for permanently submerged parts.
Applying the rule to the measured data is straightforward. A module that must hold 45 m continuously sits at 90% of P80's working depth, which is at the top of the continuous range — either accept a shorter inspection interval or move to P100, whose 80 m working depth puts the same 45 m at 56% and leaves the margin intact. Moving one grade up costs 20 kg/m³ of density and returns a pressure margin that no amount of inspection can substitute for.


